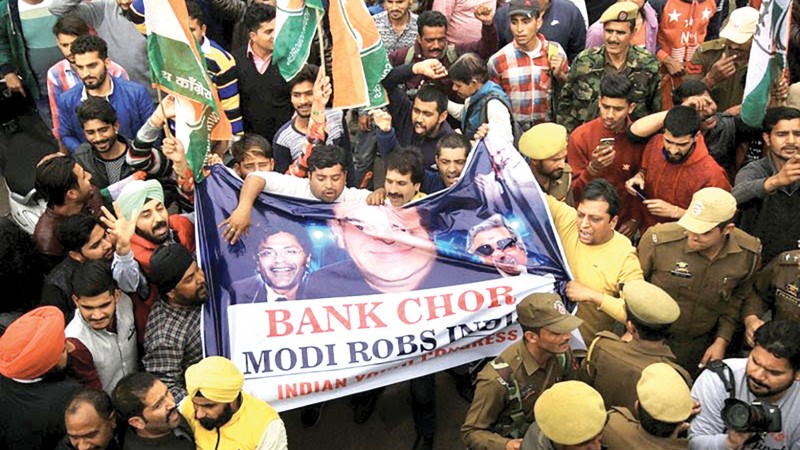
 Protest against Nirav Modi and the Punjab National Bank fraud
 India’s banking sector, the foundation of our modern economy, is in crisis. A spate of scams has dragged the credibility of India’s biggest private and public sector banks through the mud. Even more dangerous is a Debt Bomb of bad loans that has grown almost 17 times bigger in the past 10 years. The biggest culprit in the creation of this impending financial implosion is none other than Corporate India.
For the past five years India’s banking sector has been reeling under an ever-increasing weight of bad loans, known formally as non-performing assets (NPAs). Simply put, an NPA is a loan or an advance of credit taken by an individual or a company from a bank on which they have stopped paying interest and are unable or unwilling to return the loan to the bank. The number of delinquent borrowers and volume of delinquent loans have spiked since 2014 and are a grave threat to India’s economy.
Policy pundits and leading businessmen have been quick to blame public sector banks for the crisis and have called for them to be privatised. These banks, they say, should be handed over to Corporate India which will then eliminate all corrupt practices and bring in much needed efficiency and productivity. The reality, as ususal is quite different. As the data in Table 1 and the report in this article shows, Industry and Services sectors, together known as Corporate India, have been the biggest beneficiaries of all lending and are also the biggest defaulters on the loans.
Growth of Credit and Non Performaing Assets in different sectors
Sector wise break up of credit and NPAs in March 2012
| Advances (Rs. Crore) |
NPAs (Rs. Crore) |
Ratio of NPA to Advance (%) |
Share of NPA by sector (%) |
|
| Agriculture | 546600 | 25143 | 4.59 | 18.95 |
| Services | 1023000 | 30690 | 3 | 23.13 |
| Retail | 782800 | 24517 | 3.13 | 18.48 |
| Industry | 1937300 | 52307 | 2.69 | 39.43 |
Sector wise break up of credit and NPAs in March 2012
| Advances (Rs. Crore) |
NPAs (Rs. Crore) |
Ratio of NPA to Advance (%) |
Share of NPA by sector (%) |
|
| Agriculture | 992400 | 53589 | 5.39 | 8.17 |
| Services | 1620000 | 97200 | 6 | 14.82 |
| Retail | 1540300 | 30806 | 2 | 4.7 |
| Industry | 2680000 | 474360 | 17.7 | 72.31 |
Table 1 (Source – Reserve Bank of India)
Far from being the vaunted solution, the Industry and Sevices sectors are the biggest part of the problem.
And the “problem” is getting bigger by the day. Even Urijit Patel, the present governor of the Reserve Bank of India is on record saying that gross NPAs could go up from Rs. 7.9 lakh crore at the end of March 2017 to Rs. 20 lakh crore
Revelations by the Finance Ministry in the Lok Sabha claimed that the total amount of NPAs had crossed Rs. 8.5 lakh crore by the end of December 2017, with the “industry” segment contributing over 70% to that figure. The results of two studies released recently, one by the Associated Chambers of Commerce and Industry in India (ASSOCHAM) along with the credit rating agency CRISIL, and the other by another credit rating agency ICRA, both concluded that the total or Gross NPAs were expected to amount to Rs. 9.5 lakh crore by the end of March 2018.
Let us try and put these figures in some perspective. It was recently reported that the direct tax receipts of the government for the year 2017-18 was Rs. 9.9 lakh crore. This forms more than half the amount the government expected to receive in taxes (direct and indirect), as laid out in the most recent union budget. It is from this pool that government money is allocated to various schemes.
The union budget for 2018 allocated Rs. 52,800 crore towards health spending, including its ambitious newly launched National Health Protection Scheme, touted by Arun Jaitley, the Finance Minister, as the ‘world’s largest healthcare program.’ At the present level, the total NPAs are worth nearly 18 times this amount. The outlay for education stood at Rs. 85,010 crore. The total NPAs are worth 11 times this amount. The allocation for the crucial Mahatma Gandhi National Rural Employment Guarantee Scheme, in 2018, amounted to Rs. 55,000 crore. 17 such schemes could be funded with the total amount of NPAs held by the banks. Complaints regarding ‘overspending’ by the government on the social sector are vociferous and frequent from the mandarins of India’s corporate sector. However, as we shall demonstrate, the money being lent to India’s corporates, that the banks are likely to never see again, is vastly incomparable in its scale to this alleged ‘overspending.’
How did we arrive at this point though, and who is responsible for the likely disappearance of such vast sums? That is the question that we seek to answer in this article.
The Reserve Bank of India (RBI), the country’s central bank, regularly publishes data relating to the banking sector in India. Among India’s various public agencies, it is one of the more reliable reporters of data and statistics. It is from the RBI’s reported data that we can look back through the years to the root of the NPA crisis.
There were a few historical trends and policy decisions that set the stage for the spectacular growth of leanding by Indian banks, particularly to the corporate sector. The first was the explosive growth in bank deposits following India’s economic liberalisation. The deposit base for all banks grew from Rs. 1.93 lakh crore in 1990-91 to Rs. 9.6 lakh crore in 2000-01 to Rs. 52 lakh crore in 2010-11. The 2016-17 figure stands at Rs. 110 lakh crore. The other crucial factor was the progressive reduction of the statutory liquidity ratio – the percentage of deposits that banks were bound to hold in the form of cash and gold reserves, and government securities – from a high of 38.50% in 1992 to its current level at 19.5%. The two combined meant that banks were receiving more money in deposits every year, and had more of it available to hand out loans every year as well, creating a dual pressure for them to seek out lending opportunities.
The result was a vigorous increase in lending. However, as the following data will shows, this growth was unequal. The share of loans that were extended to the ‘non-priority’ sector, that is, to industries, services (together dominated by India’s major corporate players), and to retail loans, grew at a much faster clip, and occupied the lion’s share of the total lending, compared to the ‘priority’ sector (agriculture, housing for the poor, loans given to protected classes and so on).
Bank deposits and credit over the years
|
Year |
Deposits |
Credit (Rs Crore) |
||||
|
Industry |
Services |
Retail |
Agriculture |
Priority Sector |
||
|
2017 2016 2015 2014 2013 2012 2011 2010 2009 2008 2007 |
11048571 9599531 8896901 7913443 6934280 5909082 5207969 4492826 3834110 3196939 2611933 |
2680000 2730700 2675600 2516500 2230200 1937300 1604600 1311500 1054400 858300 665700 |
1620000 1541100 1413100 1337500 1151900 1023000 885400 726800 646300 549300 400500 |
1540300 1392200 1166300 1009700 897600 782800 687900 585600 562500 521800 402700 |
992400 882900 765900 666000 575600 546600 480600 415700 338700 275300 222300 |
2265500 2172400 2010300 1829700 1539800 1421000 1262400 1092200 932500 748100 623900 |
Table 2 (Source – Reserve Bank of India)

Chart 1: Sectoral Break-up of bank credit growth over the years
As can be seen clearly in chart 1, the overall growth of loans did not take place at the same rate to different segments of the economy. The rate at which it grew for the industrial sector, the primary reserve of what we know as corporate India, showed a marked difference from all the remaining segments, growing at a much faster rate than the others, beginning approximately in 2009.
As the total sums being loaned out began to grow at a fast pace in the mid-2000s, the problem of bad loans wasn’t immediately visible. It was only in around 2012 that they began to appear as a significant share of the banks’ loan portfolio’s, however, once the problem had started there was no stopping it. Consider the following data.
Growth of NPAs over the years
|
Year |
Gross NPAs |
Gross Advances |
Gross NPAs to Gross Advances Ratio (%) |
|
2017 2016 2015 2014 2013 2012 2011 2010 2009 2008 2007 2006 2005 |
790268 611607.4 322916.1 263015.1 192768.8 136968.3 93996.9 81718.1 69953.7 56606 50517 51753 57396 |
8476705.3 8171114.2 7560665.8 6875747.9 5971819.9 4648807.8 3995981.5 3262078.8 3024651.8 2503431 2007413 1545730 1167683. 5 |
9.32 7.48 4.27 3.83 3.22 2.95 2.35 2.51 2.31 2.26 2.52 3.35 4.92 |
Table 3 (Source – Reserve Bank of India)
There were two interesting ways in which this data could be broken up. The first concerns whether the NPAs are held by private sector or public sector banks. While public sector banks including all the nationalised banks, the various cooperative banks and the State Bank of India and its affiliates enjoy a much higher asset and capital base than the private sector banks, with the private market in banking only having been thrown open after economic liberalisation, the growth of deposit base and lending has been equivalent in both categories. Where the divergence arises however is in the NPA growth as the following data will show.
|
Public Sector Banks |
Private Sector Banks |
|||
|
Year |
Gross NPAs |
GNPA Ratio to Gross Advances (%) |
Gross NPAs |
GNPA Ratio to Gross Advances (%) |
|
2017 2016 2015 2014 2013 2012 2011 2010 2009 2008 2007 2006 2005 |
684732 539956.3 278468 227263.9 164500 117300 74700 59900 45000 40500 38900 41400 47600 |
11.67 9.25 4.95 4.35 3.61 2.97 2.23 2.19 1.97 2.22 2.65 3.65 5.38 |
91915 55853.1 33700 24189.5 20800 18500 18200 17600 17000 13000 9200 7800 6800 |
4.05 2.82 2.09 1.77 1.79 1.88 2.24 2.73 2.9 2.47 2.2 2.45 3.88 |
Table 4 (Source – Reserve Bank of India)
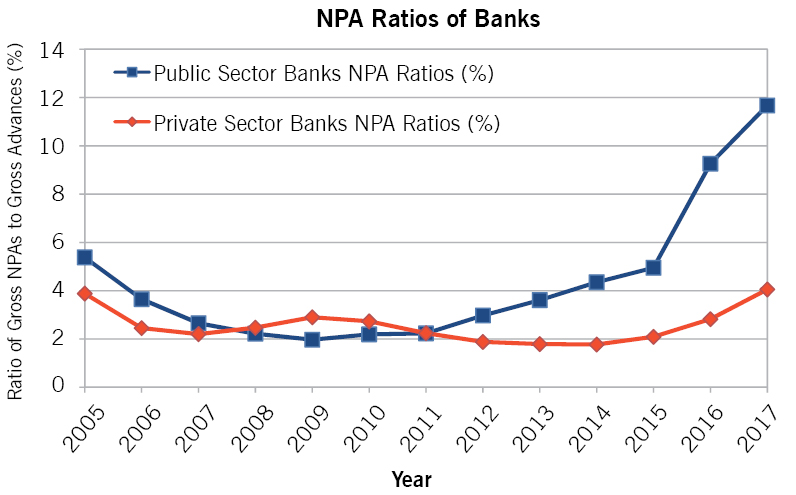
Chart 2: NPA Ratios of Private and Public Banks
As is clear from these charts, the public sector banks have a much higher quantum tied up in the NPA column, and their ratio of Gross NPAs to Gross Advances are also at a much higher level than that of private sector banks, with the divergence arising following 2012. The additional spike seen in 2015 is due to an external cause. In 2015, under the tenure of Raghuram Rajan as the governor of the RBI, the banks were ordered to undergo an exercise known as an asset quality review, and report all NPAs on their books, as a part of an effort to clean up bank balance sheets. Until then, many accounts that may have been classified as NPAs were left out of that category as banks preferred to keep the levels of NPAs low on their balance sheets. This is because, for loans under the NPA category, as well as for loans that are in classes such as “distressed” and “substandard” which both indicate that the bank is anticipating and experiencing some degree of difficulty in collecting interest payments, banks are obliged to provision equivalent amounts of capital to cover those losses. This means that the quantum available to the banks for lending is accordingly less, and this worked as an incentive against NPA reporting.
The other way in which we can break down the NPA data is by separating it into the contributions of the priority and non-priority sectors.
Priority Sector and Non-Priority Sector NPAs (for Public Sector Banks)
|
Priority Sector |
Percent Contribution to total GNPAs (%) |
Non-priority Sector |
Percentage Contribution to total GNPAs (%) |
|
|
2017 2016 2015 2014 2013 2012 2011 2010 2009 2008 2007 2006 2005 |
160941.60 125809 96611 79899 67276 55780 40186 30496 24201 24874 22519 22236 21536 |
23.5 23.2 34.69 35.16 40.91 47.57 53.82 50.89 53.75 61.48 57.96 53.75 45.22 |
523790.71 414148 181598.49 147234.80 98030.81 58826.44 34235.45 29113.66 20527.81 15007.42 15603.01 18278.58 25493.74 |
76.50 76.70 65.21 64.79 58.39 50.17 45.85 48.58 45.59 3710 40.16 44.18 53.53 |
Table 5 (Source – Reserve Bank of India)

Chart 3: Growth of NPAs in Priority and Non-Priority Sectors
The ‘non-priority’ sector includes industry, services and retail loans. The sharp growth of the non-priority sector NPAs, accompanied the sharp growth in lending to industry that we saw earlier, with the NPAs beginning to show within a couple of years of the growth of lending to industry beginning to diverge from the growth rate of lending to other segments. An identical spurt in the share of industry in NPAs was also evident. While collated year-on-year data is unavailable, intermittent reporting by over the years has seen the share of industry in the total quantum of NPAs rise to as high as 73.33% of gross NPAs by December 2017, as was revealed by the finance ministry in a response to a question in the Lok Sabha. In 2014, that figure stood at 53.1%, and back in 2012 the figure was 38.1%.
In the same period the share of the agriculture and retail segments in total NPAs have both fallen significantly. Agriculture’s share has fallen from around 18% in 2012 to around 6% in 2017, while the retail segment’s share has fallen from around 18% in 2012 to around 4% in 2017. Services too fell from around 22% of total NPAs in 2012 to around 12% in 2017. The centrality of the industry segment to the NPA crisis is further demonstrated by the fact that the stark increase in share of NPAs has been followed by a slowing of lending to industry, with the line in chart 1 for credit to industry flattening out in 2016-17, as the NPA ratio rises.
Combine this dominance of industry in the share of NPAs with the share of public sector banks in total NPAs, and the result is that the bulk of the NPAs in the banking sector are bad loans given to corporate India by our public sector banks.
How and why does this situation constitute a debt bomb? First we must take into account the fact that the quantum of NPAs are only set to increase in the next few years. In a recent interview with an online portal, Urijit Patel, the present governor of the RBI stated that in his estimation gross NPAs could be expected to rise up to Rs. 20 lakh crore. This will constrain the lending capability of the banking sector, as they will have to provision for these loans. That provisioning capacity is derived from the deposits that the bank receive from ordinary customers. A recent recapitalisation plan by the government is due to divert Rs. 2.11 lakh crore of public money into public sector banks. Thus, either way, public money will have to be pressed in to cover the bad loans that are weighing on the banking system.
The other aspect of the issue is the consequences of the attempts at dealing with the NPAs that are currently on the banks’ books. For over 2 years now, Indian media has been reporting a mass sale of assets by a number of major Indian companies and corporate groups. These are a fallout of the bad loans that these companies have taken from the banks, and are a preventative measure by these companies in order to avoid bankruptcy proceedings. As long as large sections of corporate capital are tied up in buying up these kinds of distressed assets, their capacities to invest in newer projects will remain suppressed which will create ripple effects on employment, consumption and thus development as a whole across the entire economy.
This article is part of a series in which we shall take a thorough look at the crisis of bad loans that India’s banking sector is facing. In Part 1, we have looked at the banking side of the story, examining the growth of bad loans in India’s banking system over the years. In Part 2, we will look at the story from the side of Corporate India, tracing how corporate debt built up and fostered bad loans in such massive quantities. In Part 3, we will consider the role of the regulators and the government, in terms of how they have sought to address the crisis, and what possibilities lie ahead.